Further Links
Power spectral density
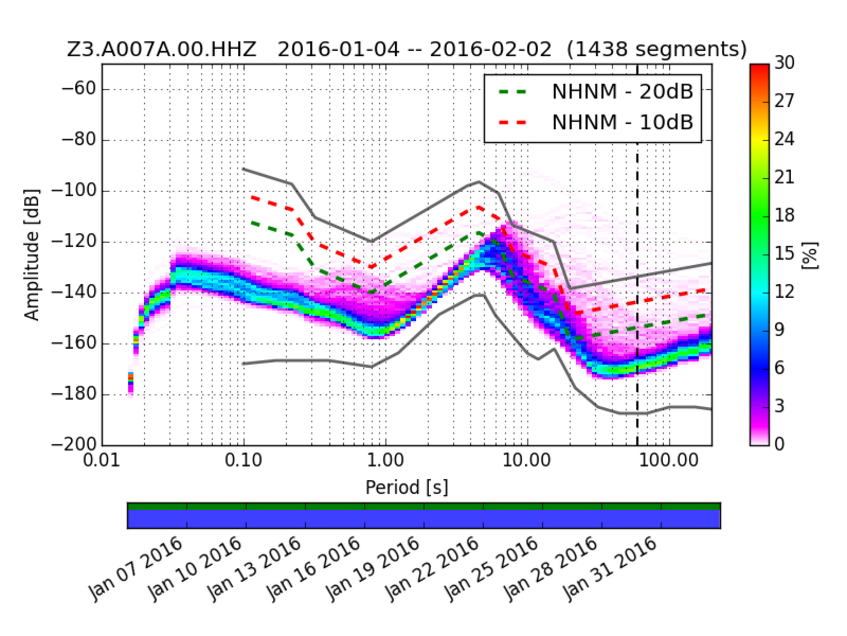
Power spectral density of A007A for January 2016, vertical component (© IMGW)
Power spectral density
The effective sensitivity of a seismic station for the detection of weak earthquakes can be estimated by calculating the probabilistic power spectral density. A graph like above visualizes the spectral power of the measured ground motion over a wide frequency range (here plotted as period = inverse of frequency). The gray lines mark seismological conventions of a noisy (top) station and a quiet (bottom) station, respectively. The closer the measured power spectral density is to the bottom line the weaker the earthquakes that can be measured. The broad peak in the center of the graph is due to the seismic background noise which is mainly generated in the Earth's oceans (microseism).
The graphs are created using the ObsPy Software.
You can download the monthly probabilistic power spectral densities of our stations here:
2015 : July - August - September - October - November - December
2016 : January - February - March - April - May - June
July - August - September - October - November - December
2017: January - February - March - April - May - June
July - August - September - October - November - December
2018 : January - February - March - April - May - June
2019 : January - February - March - April - May - June